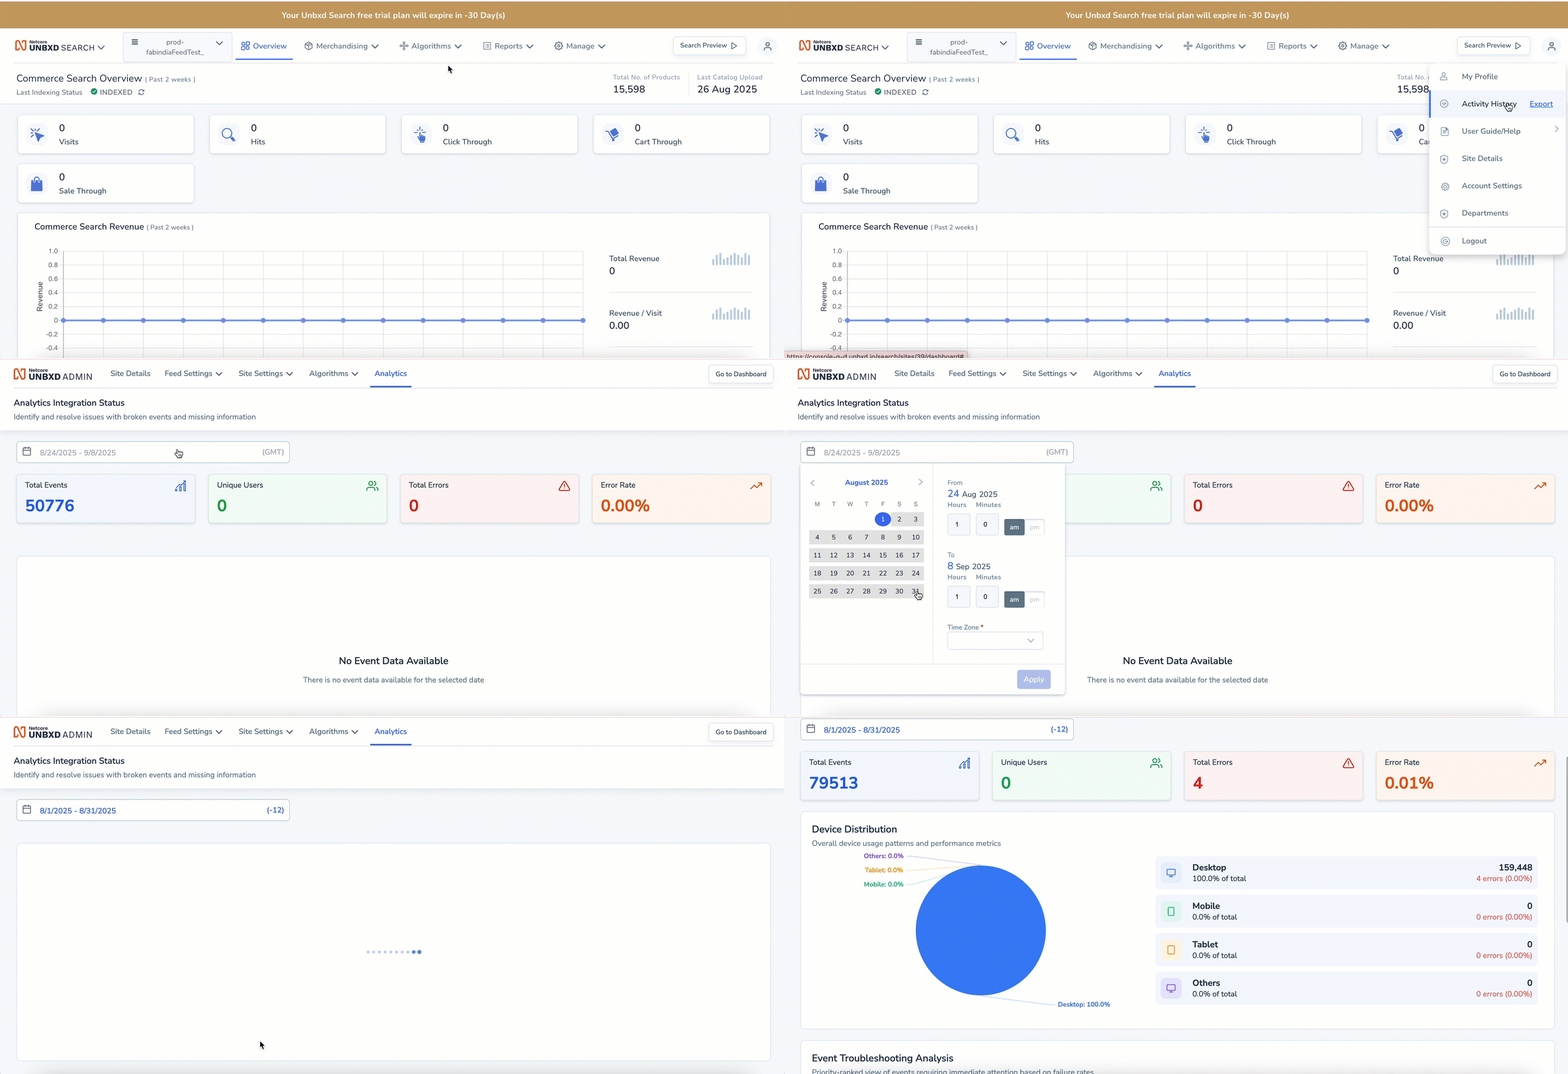
Analytics Dashboard
Monitor total events, unique users, and error rates with the Analytics dashboard to ensure accurate tracking and resolve issues quickly.
Overview
The Analytics section provides detailed insights into event tracking, error monitoring, and device distribution for your site. This helps identify broken events, resolve missing data issues, and improve tracking accuracy.
Log in to the Netcore Unbxd site
- Navigate to Profile > Site Details.
- Click on the Analytics tab.
- Select the desired date range to view reports.
ImportantThe Analytics section is restricted to internal use and is available exclusively to Unbxd Admins.

Navigate to Analytics Dashboard
Key Metrics
The key metrics help track event health and data accuracy on the Analytics dashboard.
| Metric | Description |
|---|---|
| Total Events | Total number of tracked events within the selected date range. |
| Unique Users | Number of distinct users generating events. |
| Total Errors | Count of errors detected in event tracking. |
| Error Rate | Percentage of errors against total events. |
Device Distribution
This shows how events are distributed across devices and helps identify device-specific issues and usage trends.
- Desktop
- Mobile
- Tablet
- Others
Event Troubleshooting Analysis
This section provides a priority-ranked view of events with errors so that admins can focus on the most critical issues first.
- Graph View: Highlights event types with their corresponding error counts.
- Event Table: Provides a detailed breakdown of event types, total events, total errors, and device-level splits.
| Type | Total Events | Total Errors | Desktop |
|---|---|---|---|
| SEARCH | Shows total search-related events and associated errors. | Errors are flagged here for quick review. | Device split available. |
| UNKNOWN | Lists events not mapped to known categories. | Often indicates broken or misconfigured events. | Device split available. |
FAQs and Troubleshooting
Q. What is the purpose of the Analytics section? A. The Analytics section provides detailed insights into event tracking, error monitoring, and device distribution for your site. It is designed to help you identify broken events, resolve data issues, and improve the accuracy of your site's tracking.
Q. Who can access the Analytics dashboard? A. Access to the Analytics section is restricted to Unbxd Admins only. It is not available to other user roles.
Q. What kind of key metrics are available in the Analytics section? A. The Analytics dashboard provides key metrics to track the health and accuracy of your event data. These metrics include:
- Total Events: The total number of events tracked within the selected date range.
- Unique Users: The number of distinct users who generated these events.
- Total Errors: The total count of errors detected in your event tracking.
- Error Rate: The percentage of errors relative to the total number of events.
Q. What is Device Distribution, and how is it useful? A. Device Distribution shows how events are split across devices: Desktop, Mobile, Tablet, and Others. This information helps you identify potential issues that might be specific to a certain device type and understand user behavior trends.
Q. What is Event Troubleshooting Analysis? A. This section provides a prioritized view of events with errors, allowing admins to focus on the most critical issues first. It includes a Graph View that highlights event types and their error counts, as well as an Event Table with a detailed breakdown.
Updated about 2 months ago
