A/B Tests Report
Learn how to analyze A/B test reports in Unbxd to compare campaign performance, track KPIs like Click Rate, Average Order Value(AOV), Conversion Rate, and identify winning search and merchandising strategies.
Overview
The A/B Reports section provides a detailed view of your A/B testing campaigns, allowing you to analyze and compare the performance of different merchandising strategies or Netcore Unbxd’s default results.
Log in to your Netcore Unbxd Search Panel and navigate to Reports > Search > A/B Tests.
A/B Test Report Analysis
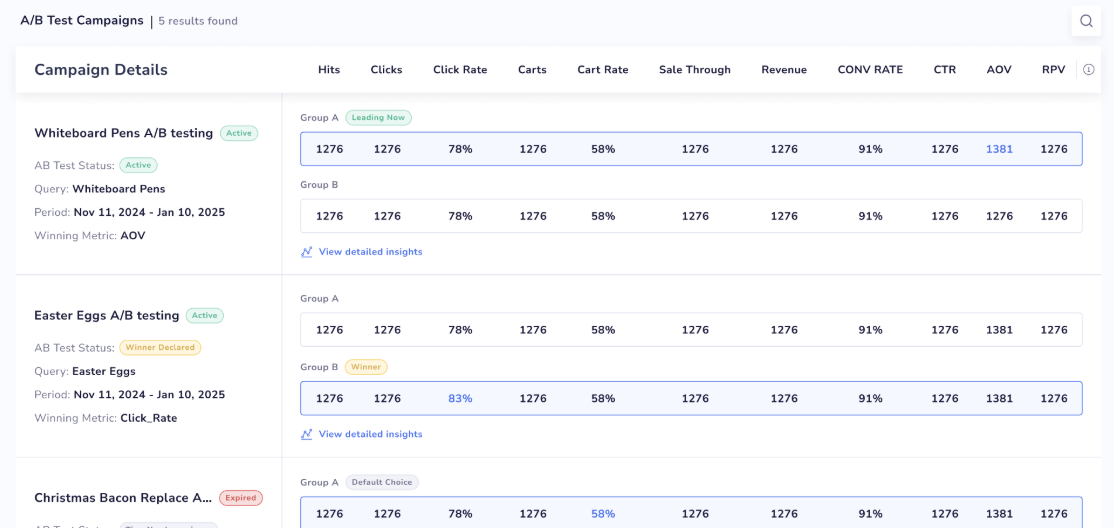
Campaign Details
On the reports dashboard, each A/B test campaign is listed with the following details:
| Field | Description |
|---|---|
| Campaign Name | The title of the A/B test. For example, Whiteboard Pens A/B testing |
| AB Test Status | Indicates the status of the test, whether the test is:
|
| Query | The search query associated with the test. |
| Period | The date range during which the test is active, for example, November 11, 2024 to January 10, 2025 |
| Winning Metric | The KPI chosen to determine the winner. |
Performance Metrics
For each campaign, Group A and Group B performance is compared across key metrics:
| Metric | Description |
|---|---|
| Hits | Number of times the test results were displayed. |
| Clicks | Total clicks on results during the test. |
| Click Rate (CTR) | Percentage of clicks against hits. |
| Carts | Number of items added to the cart. |
| Cart Rate | Percentage of cart additions vs. hits. |
| Sale Through | Count of successful sales during the test. |
| Revenue | Total revenue generated from the test. |
| Conversion Rate (CONV RATE) | Ratio of transactions vs. hits. |
| AOV (Average Order Value) | Average value per order in the test. |
| RPV (Revenue per Visit) | Average revenue generated per visit. |
Each campaign includes a link to View detailed insights for deeper analysis of performance trends. You can click See products to view your products.
Group Comparisons
Group A and Group B represent the two variations being tested.
Tags highlight performance:
- Leading Now: Variation is currently performing better.
- Winner: Declared winning variation based on selected KPI.
- Default Choice: Fallback option when no clear winner emerges.
Set up A/B Testing
Navigate to Merchandising > Search > Promotions. Click Add rule promotion to create a new Promotion campaign.
While setting up the promotion rule, use the toggle A/B testing to enable it.
Enable A/B testing
Configuration of A/B testing
- Traffic Split: Decide traffic division, for example, 50-50.
- Select KPI: Choose metric (Click Rate, AOV, RPV, Conversion Rate, Cart Rate).
- Set Duration: Ensure test period is shorter than campaign duration.
- Fallback Strategy: Assign a preferred variation if no winner emerges.
Click Apply to run the test with Variation A vs Variation B or Netcore Unbxd’s default set. The A/B Reports then reflect these test configurations and track the metrics to help identify the winning strategy.
Conclusion
The A/B Reports provide clear, side-by-side comparisons of test variations across critical KPIs, enabling data-driven decisions. You can optimize merchandising strategies by leveraging detailed insights, improve click-through and conversion rates, and maximize revenue outcomes.