Recommendations Reports
Overview
The Reports section summarizes the overall recs performance of your website and allows you to take data-backed decisions to improve conversion on your website continuously. The analytics data collected on your website is aggregated and summarised as reports to enable you to derive insights from the reports. The insights gained from Unbxd reports can be used to create marketing campaigns, configure browse and search, and autosuggest to improve conversions.
The Report section gives in-depth insights into visitor interactions, page performance, and product performance. Merchandisers can take quick actions on pages and fields on the site by referring to the Reports section of the console.
Overall Performance
The overview page gives holistic view of essential performance metrics such as Clicks, Carts, Orders, %Conversion Rate, or Revenue for the last 15 days. It helps merchandisers get a complete understanding of the impressions gained, products clicked or bought, and so on a quick glance.
Study Correlation Metrics
The recs report allows you to review trends in its performance over time. You can select and plot any 2 metrics from ‘Impressions’, ‘Clicks’, ‘Carts’ ,’Orders’, ‘Revenue’, or ‘% Conversion rate’ to check how the metrics varied over a selected duration.
A product manager or e-commerce director can use this feature to quickly verify their hypothesis by studying the correlation between two parameters. For example, if you have revamped the UI of the product listing page on July 13 2020. You can plot a chart between Page Views & Clicks from July 13, 2020, to July 27, 2020. If the new UI is better than the old UI, then you can spot a sudden jump in clicks chart after July 17, 2020.

Selecting Date & Time for a report
Reports are always generated for a defined time range.
You can apply this filter to generate a report for the selected date and time range:
- Past 1 week
- Past 2 weeks
- Past 1 month, or
- Custom range
NOTEThe analytics events generated from your website are aggregated and available for this report immediately.
Explanation of Metrics
The reports are generated based on various metrics. Understanding these metrics is extremely important in order to extract the maximum output value. All the metrics used in our reports are mentioned below:
Metrics | Description |
|---|---|
Impressions | Number of times shoppers click the product from the recommended widget |
Clicks | Number of times shoppers select a product from the Product Listing Page (PLP) |
Carts | Number of products that are added by the shoppers to their temporary shopping list to place an order then or later |
Products Sold | Number of times shoppers select products from the cart with an intent to buy |
% Conversions | % Conversion rate = Number of orders /Number of hits a product gets. Conversion Rate is defined as how many products were ordered out of the page types that were browsed |
% Click Through Rate (CTR) | % CTR = Number of clicks /Number of hits. CTR defines how many times shoppers selected a product after browsing for it |
Average Order Value (AOV) | AOV = Total revenue/Total number of orders. AOV defines average money spent for every order that was placed by a shopper on mobile application or a website |
% Sell Through Rate (STR) | % STR = Number of inventory purchased / Sold to the customer. STR defines how many products were sold out to the amount of inventory purchased by the merchandiser |
Revenue | Amount generated for the number of orders placed by the shoppers |
Site Reports
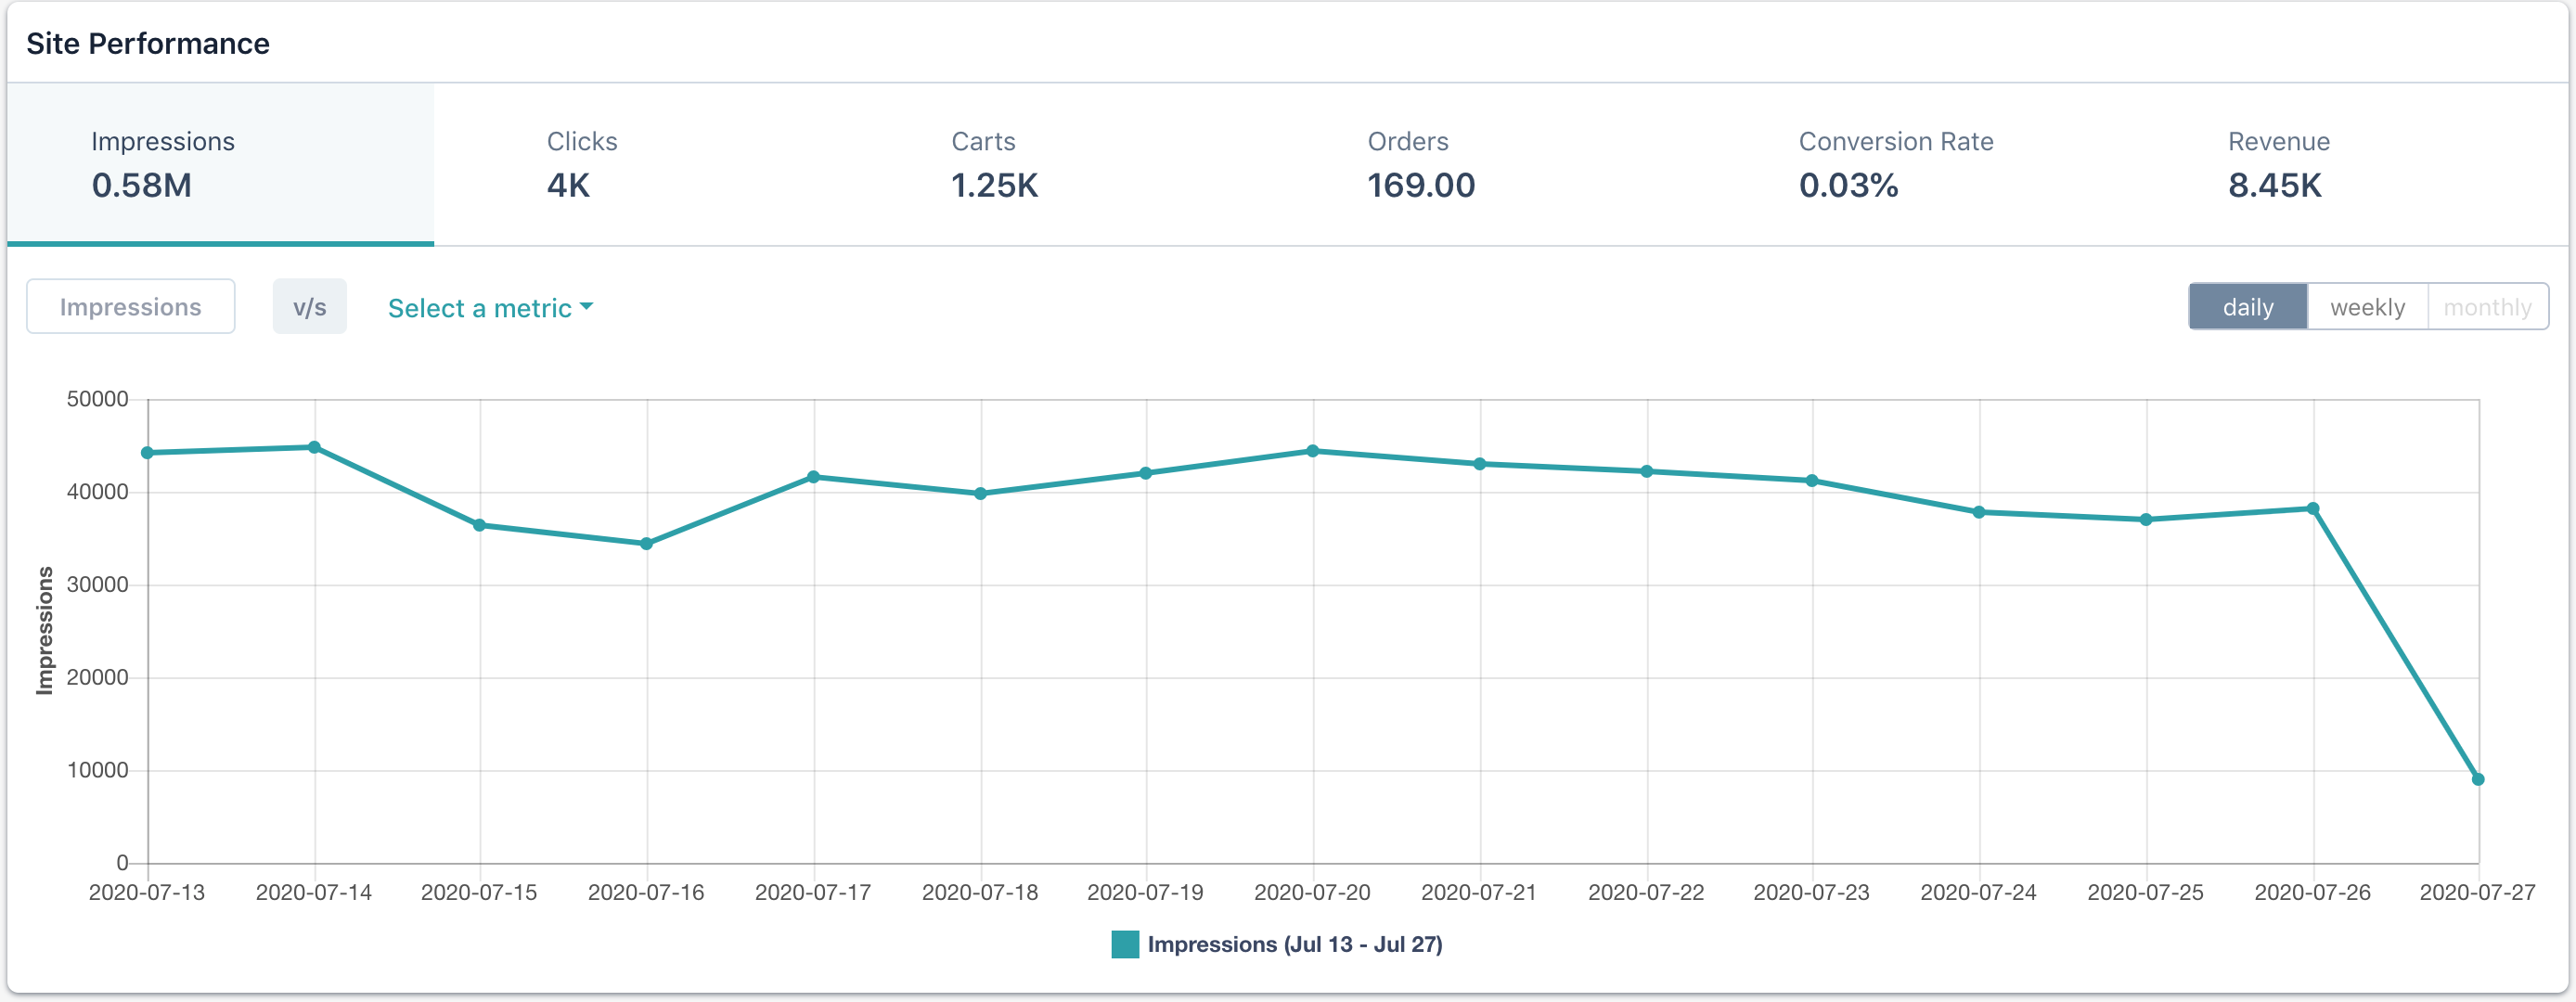
The Site report displays the site metric as to how many times the product was viewed from the category page, added to cart, or ordered.
Site Reports Details
As we can see, the widget impressions are 0.58M, products from the recommended widget were clicked 4K times, added to the cart 1.25K times, and ordered 169 times for a week. This calculates the conversion rate of 0.03% and revenue to be 8.45K.
You can also download a site report. To do that, click the ‘download’ icon.
Page-Type Reports
The page-level reporting section gives a detailed report of pages based on impressions, clicks, carts, orders, %conversion, CTR, and revenue.
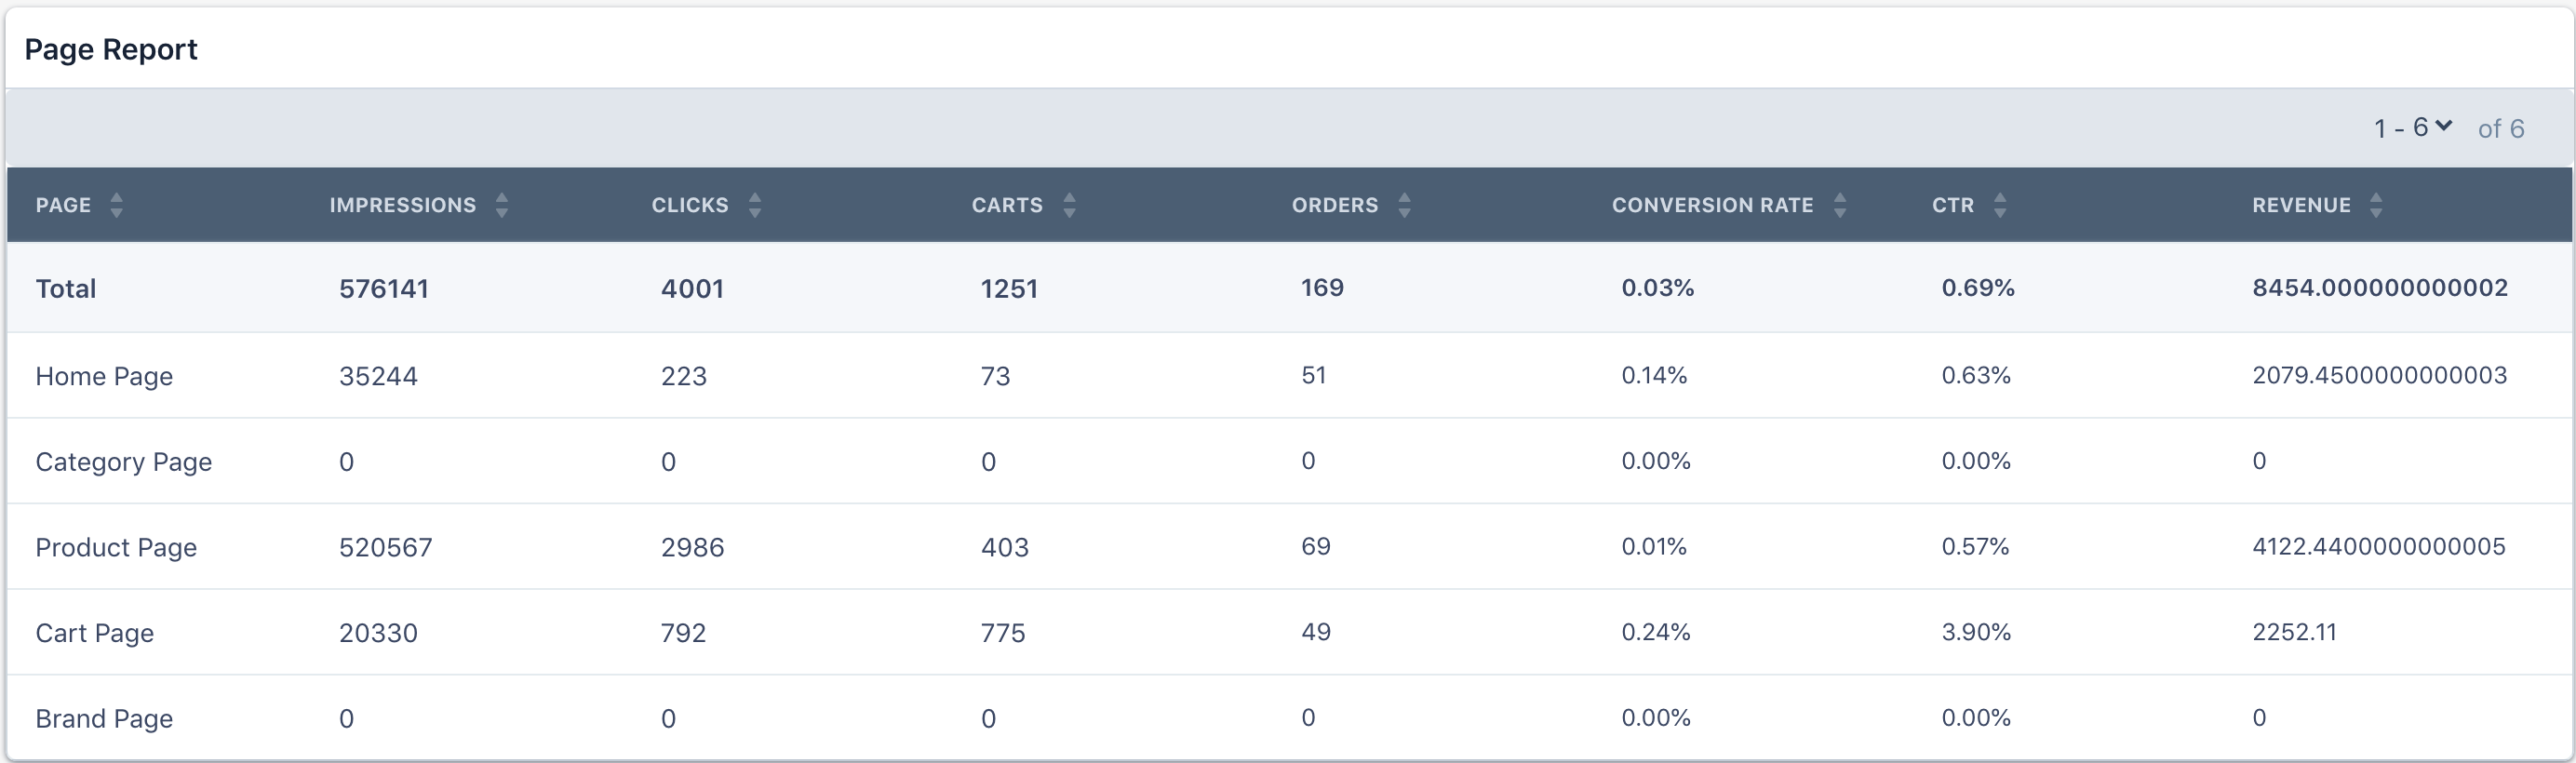
As you can see in the illustration above, we can decipher the insights for the various page types. With every page type, the impressions, clicks on the recommended products, additions to the cart, and orders are displayed. As a merchandiser, these insights may help you boost high-performing page types.
By default, the queries are sorted on hits in ascending order; however, you can sort on any of the other metrics. A standard date selector interface lets you change the time for the report.
Home Page Reports
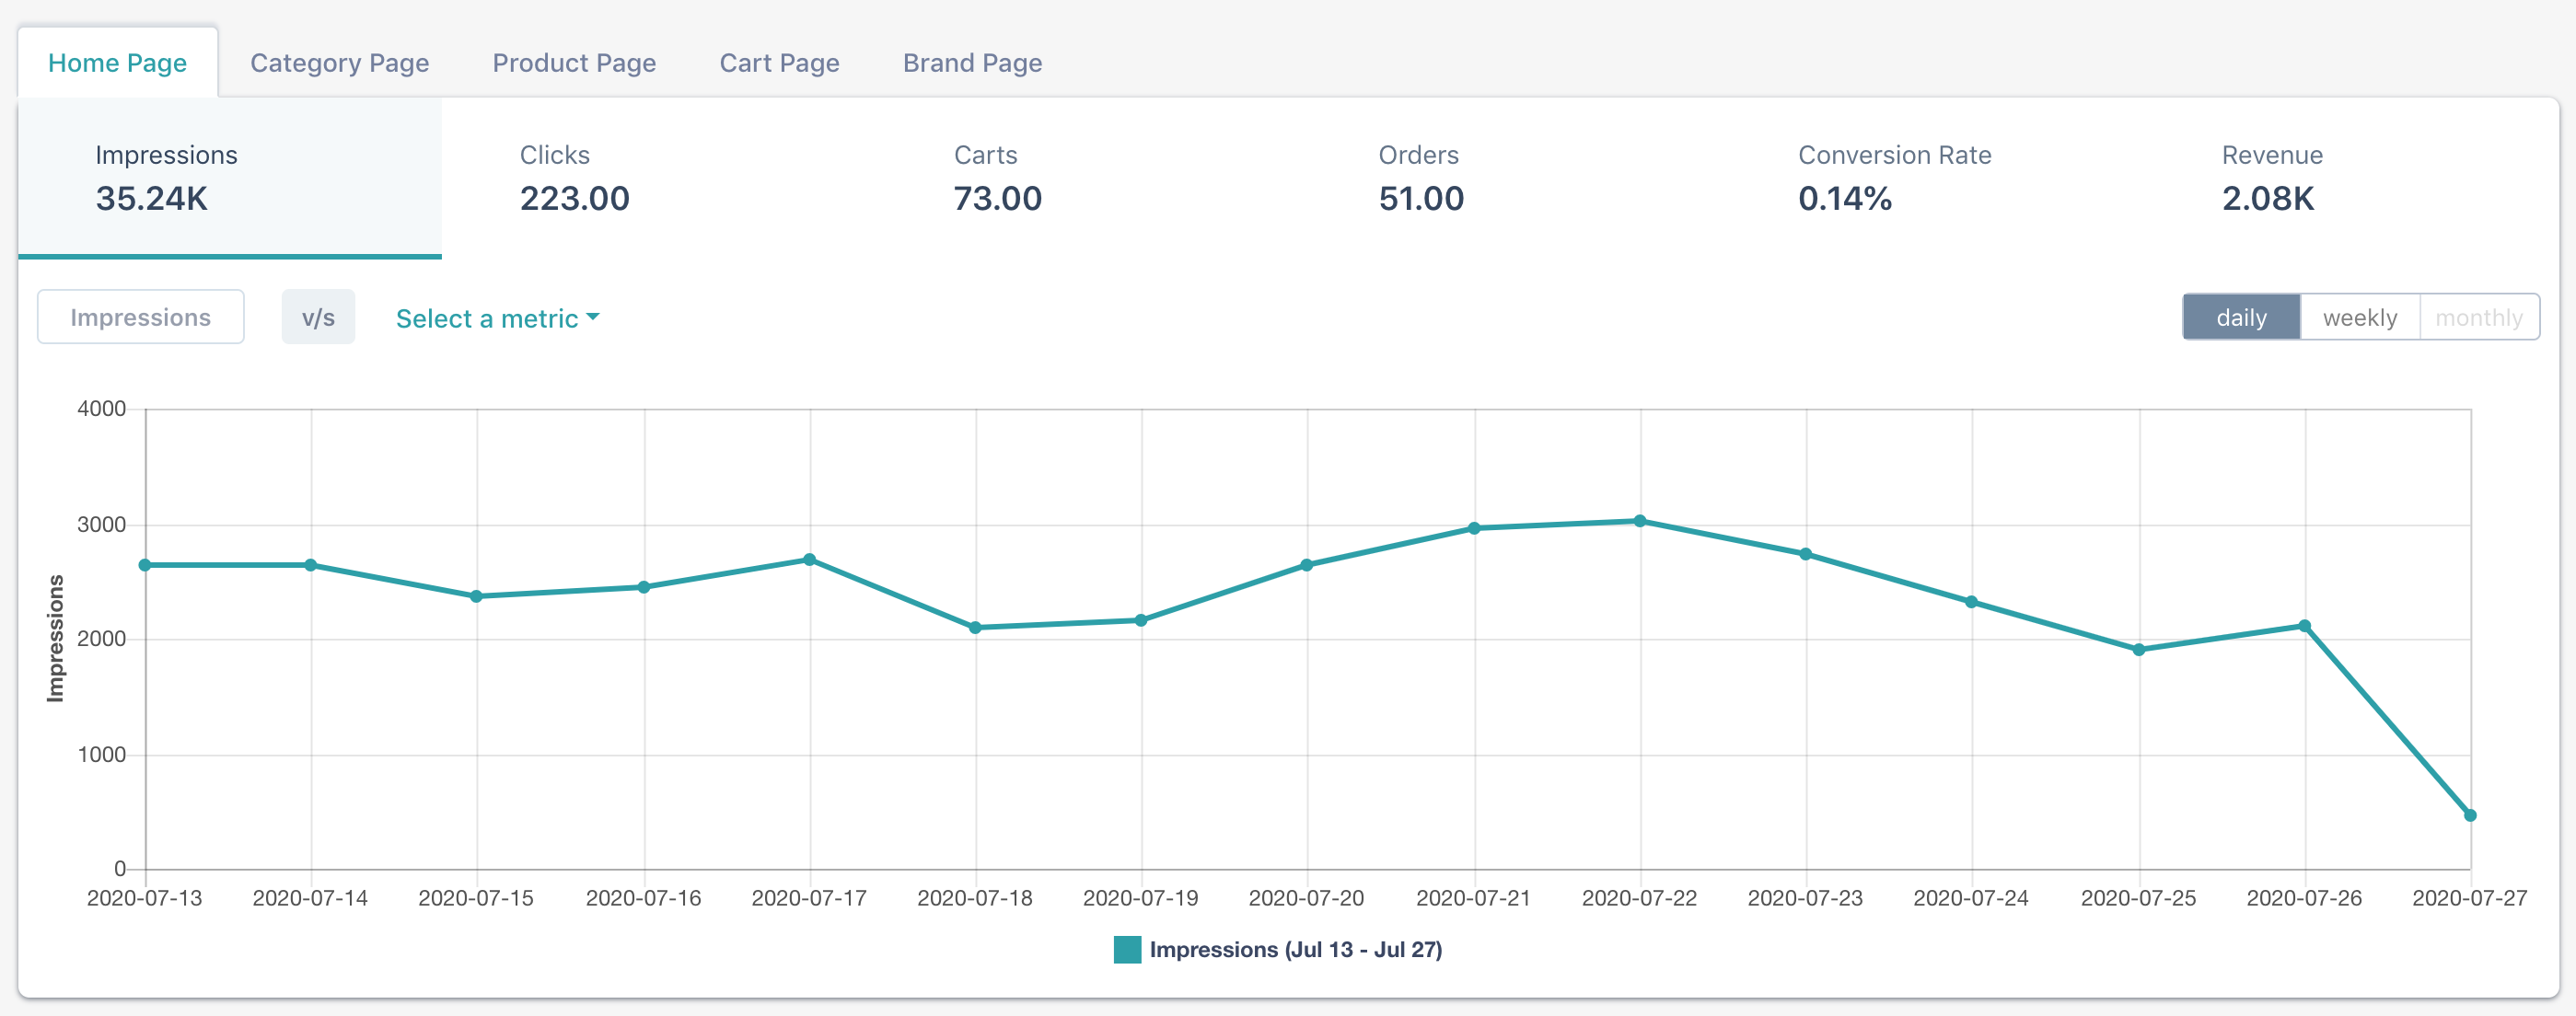
Home Page Report
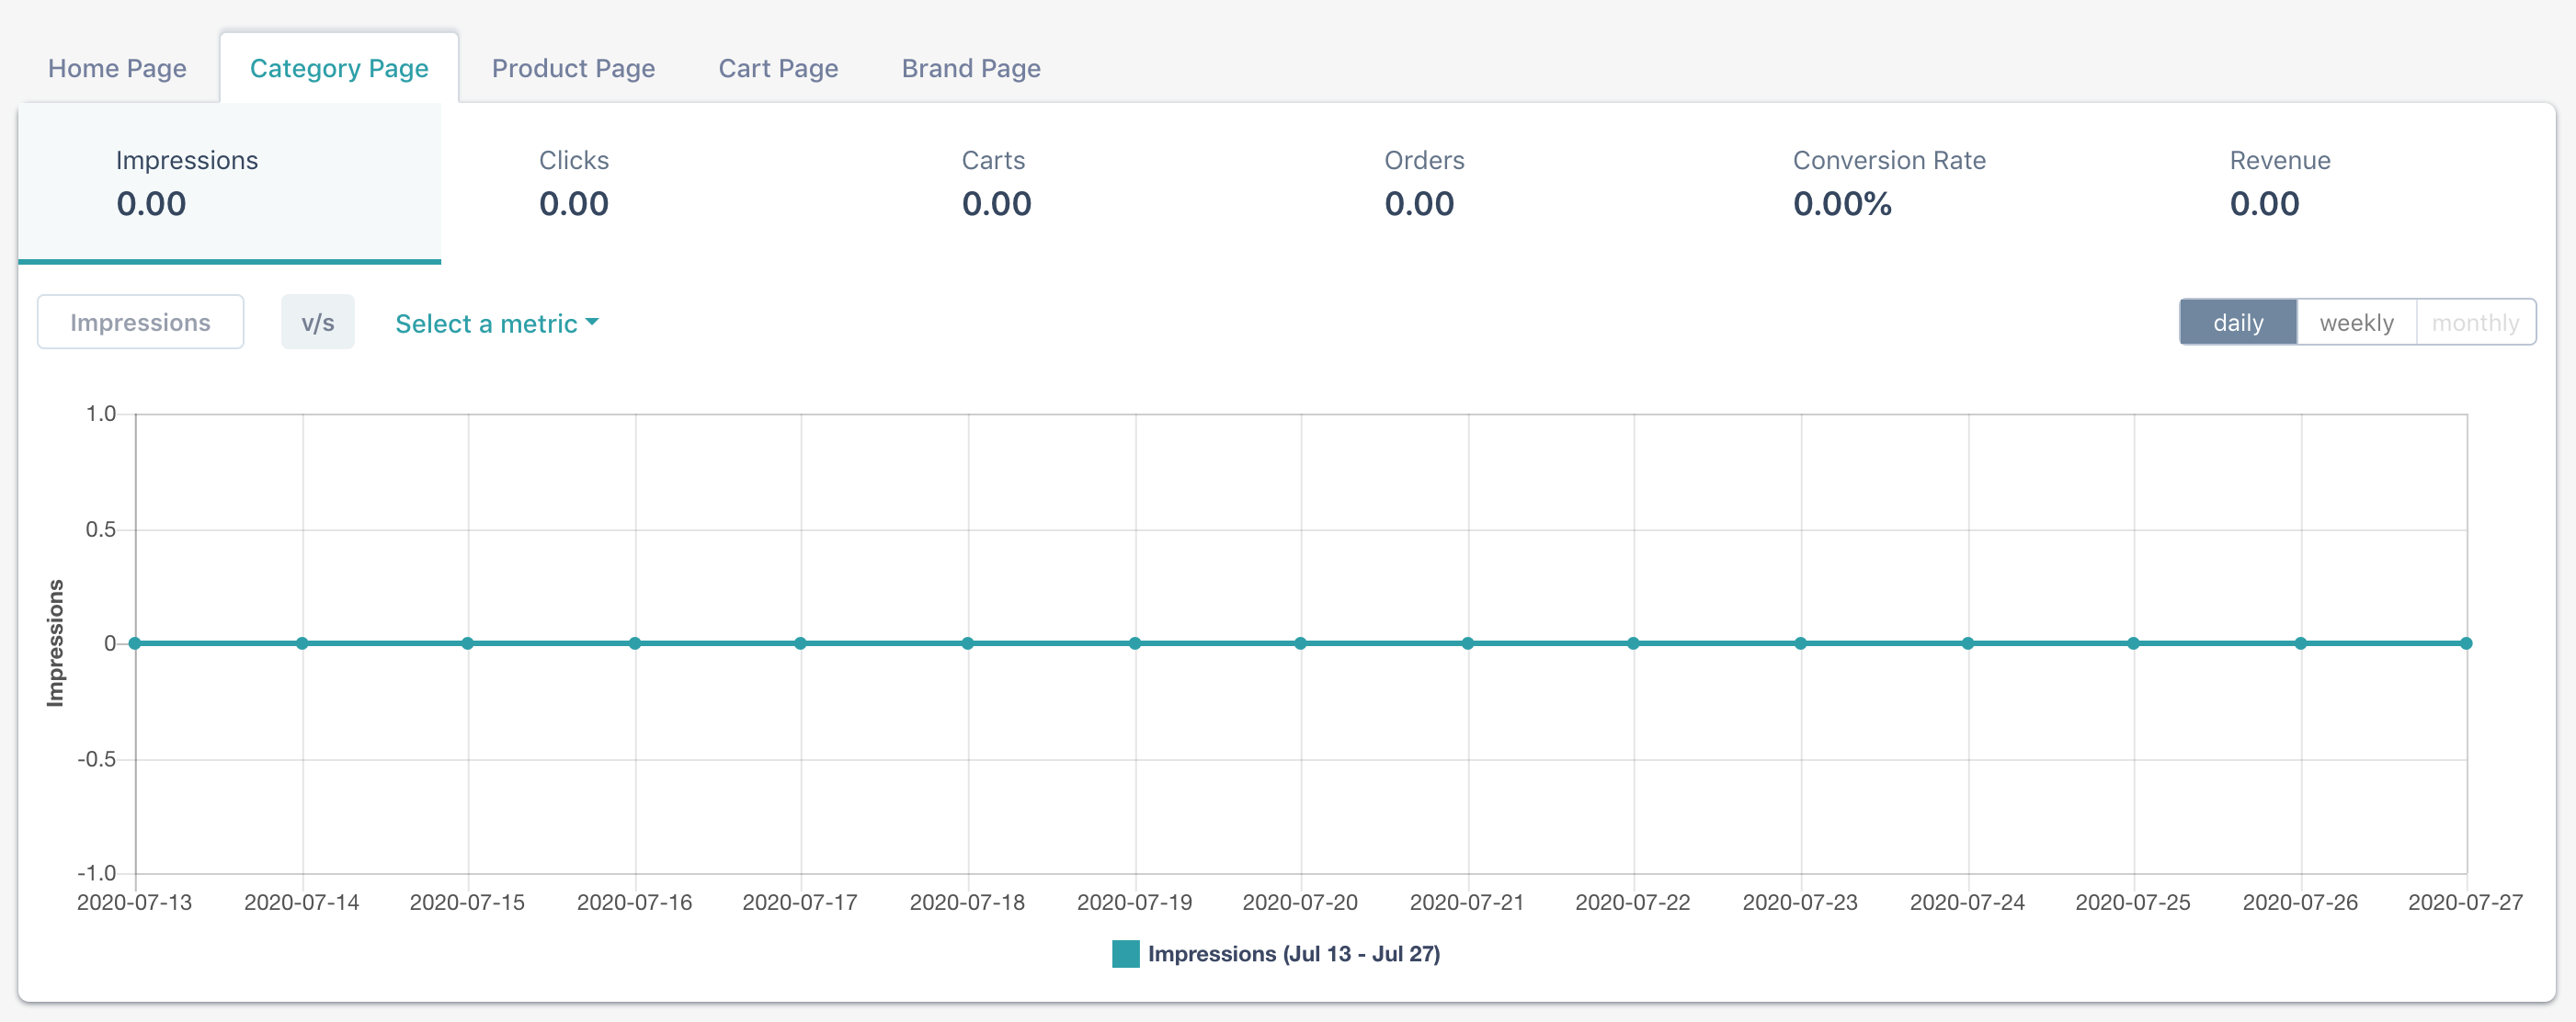
Category Page
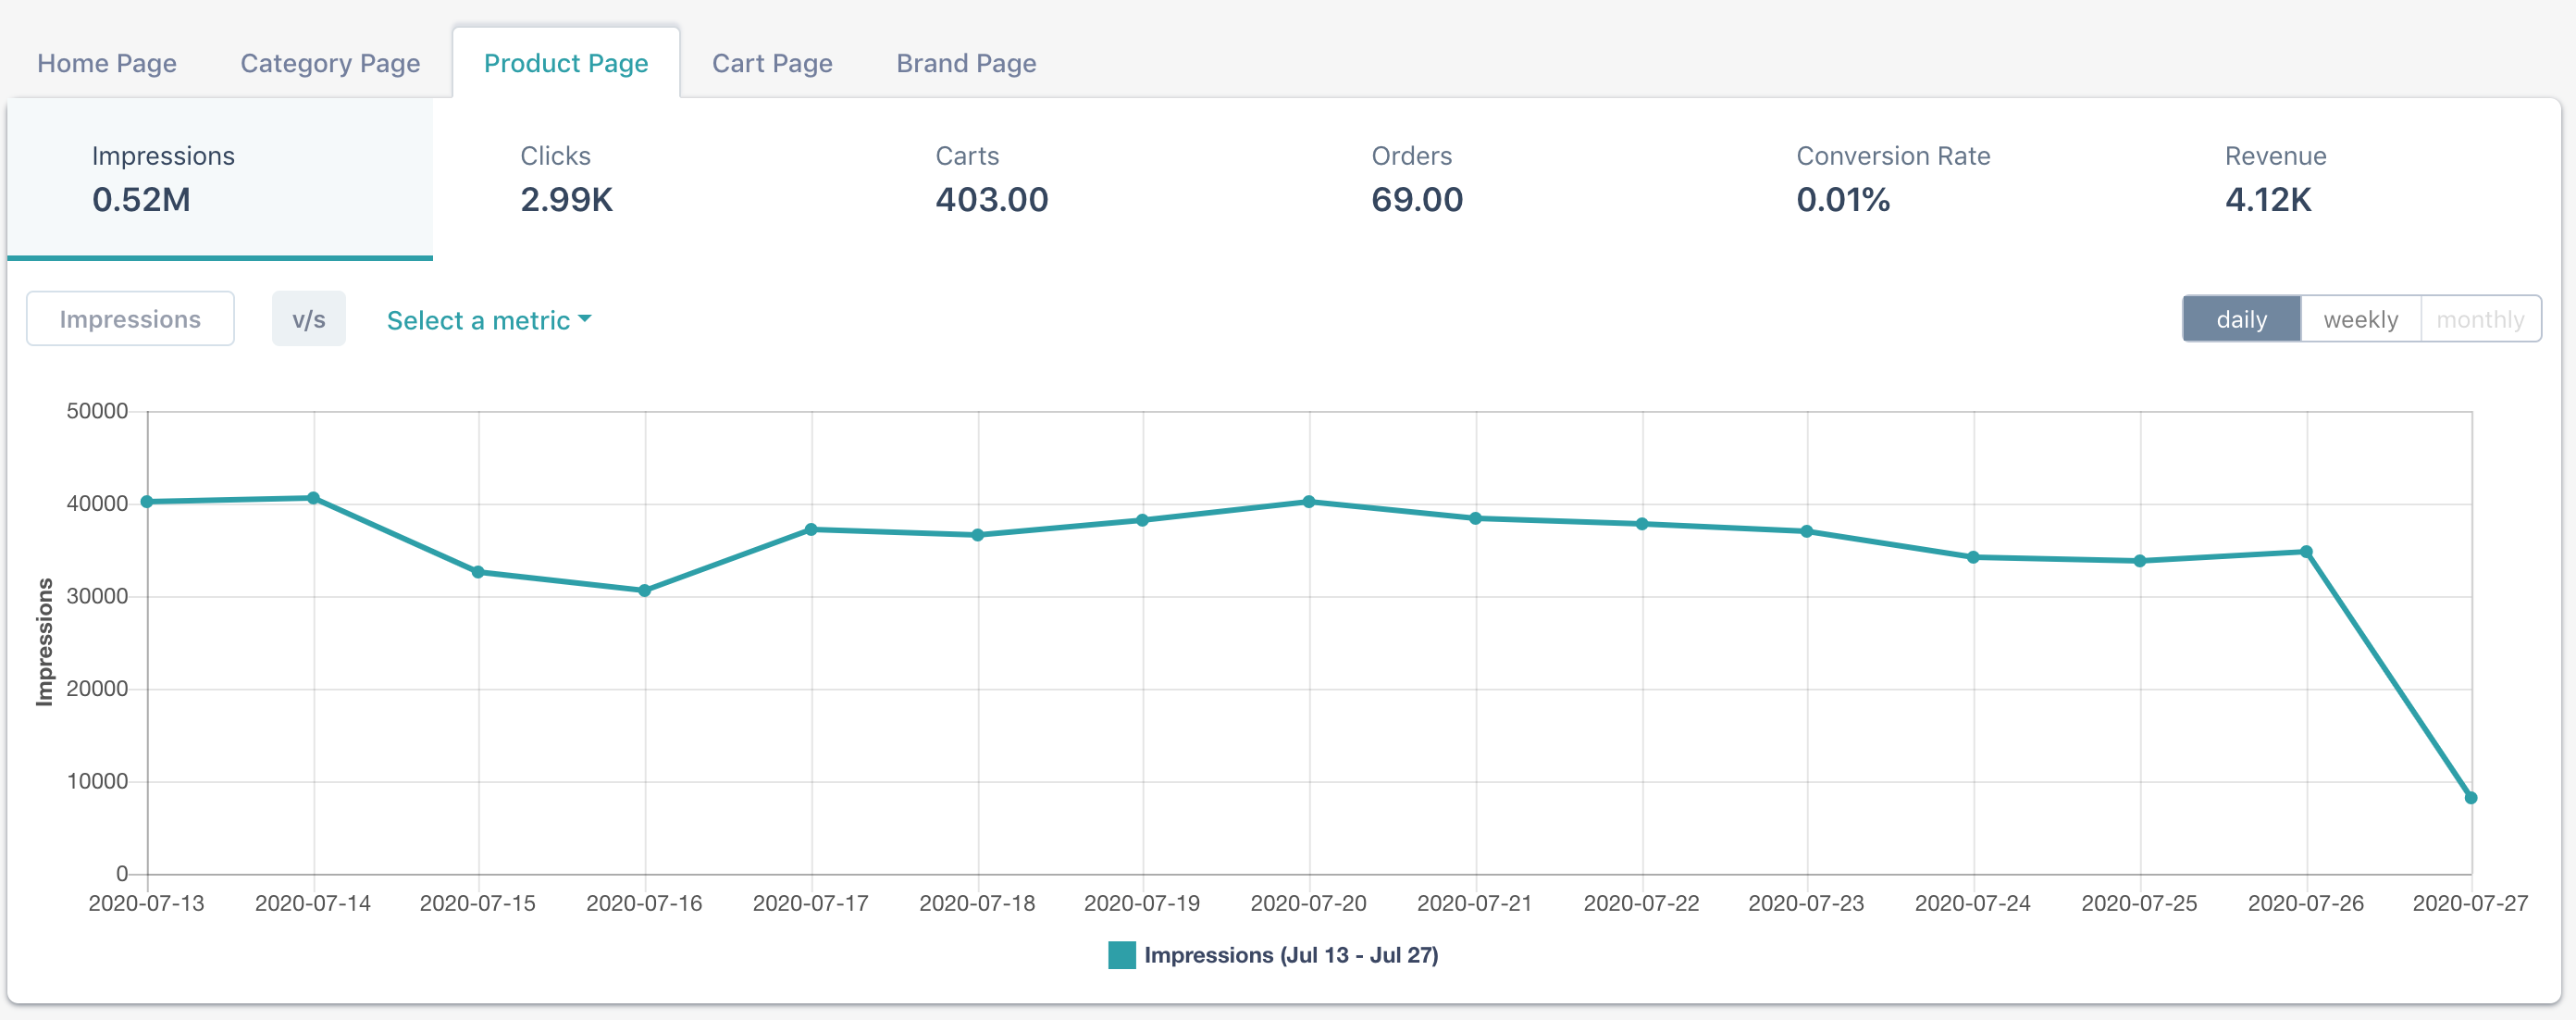
Product Page
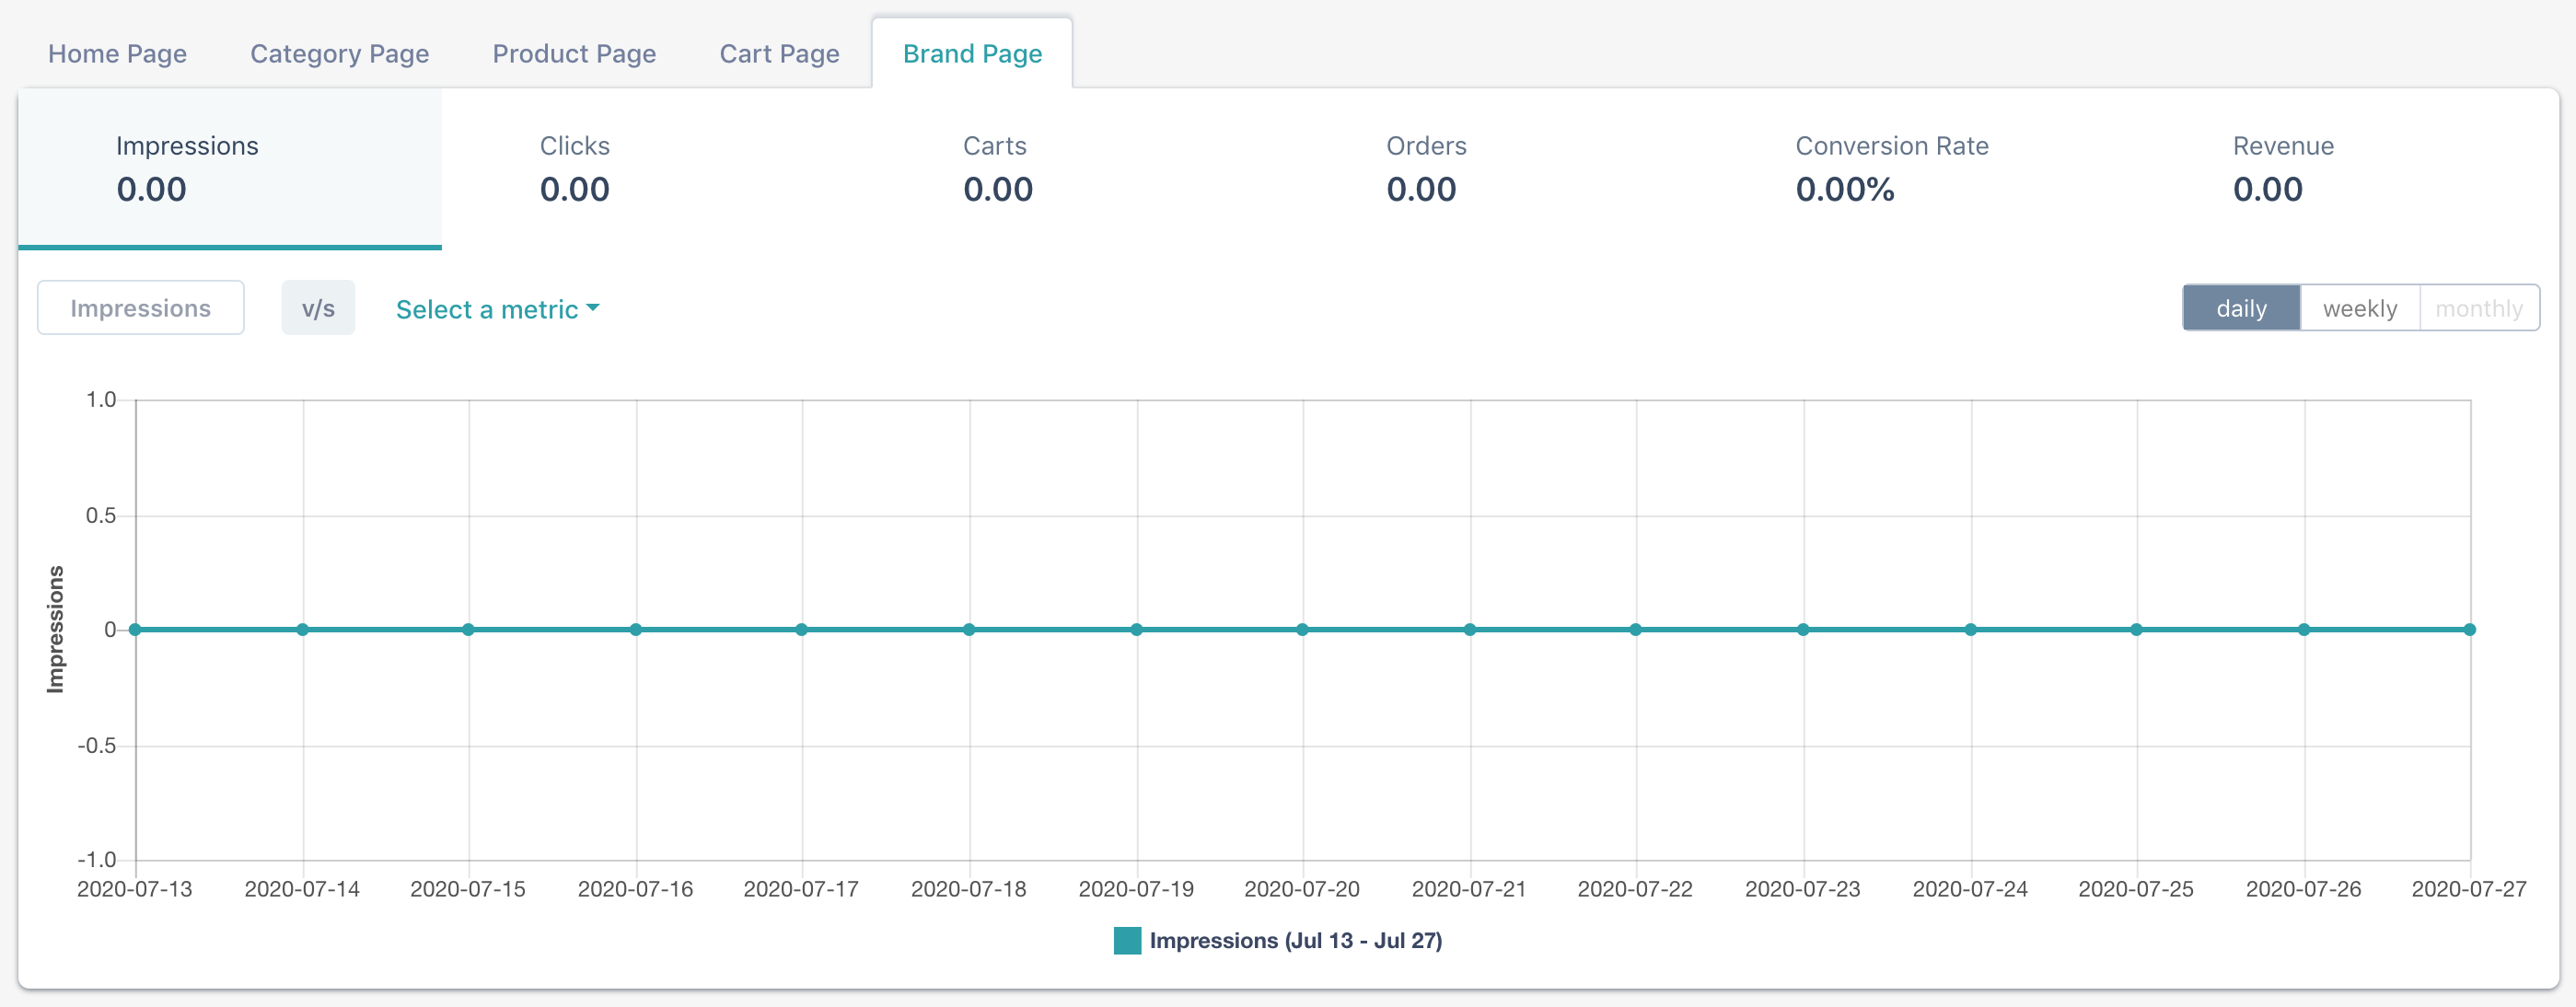
Brand Page
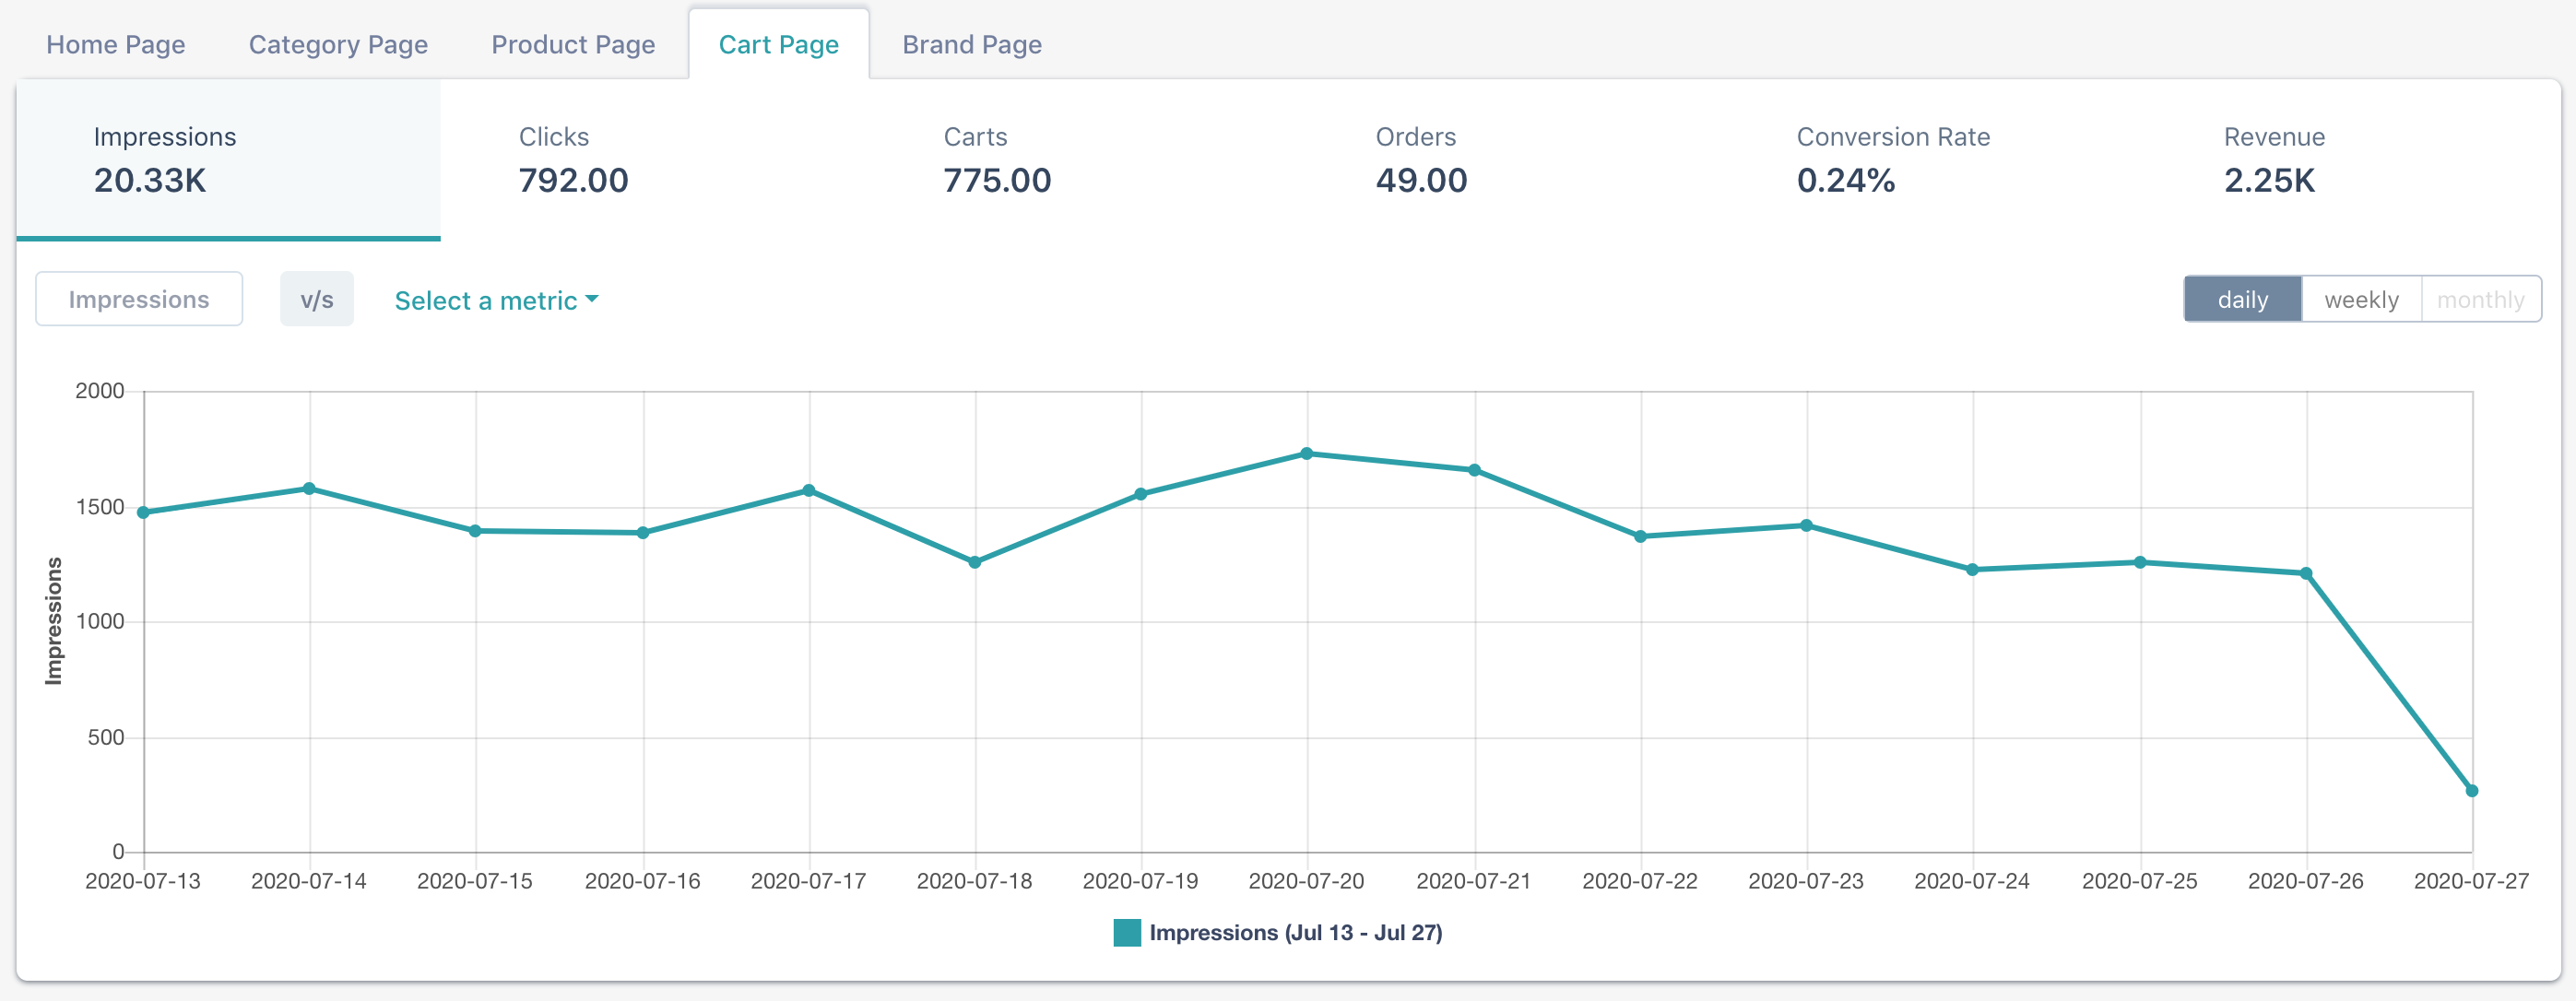
Cart Page
Widget Reports
Widget Reports gives an insightful report around the widget performance for each page type.
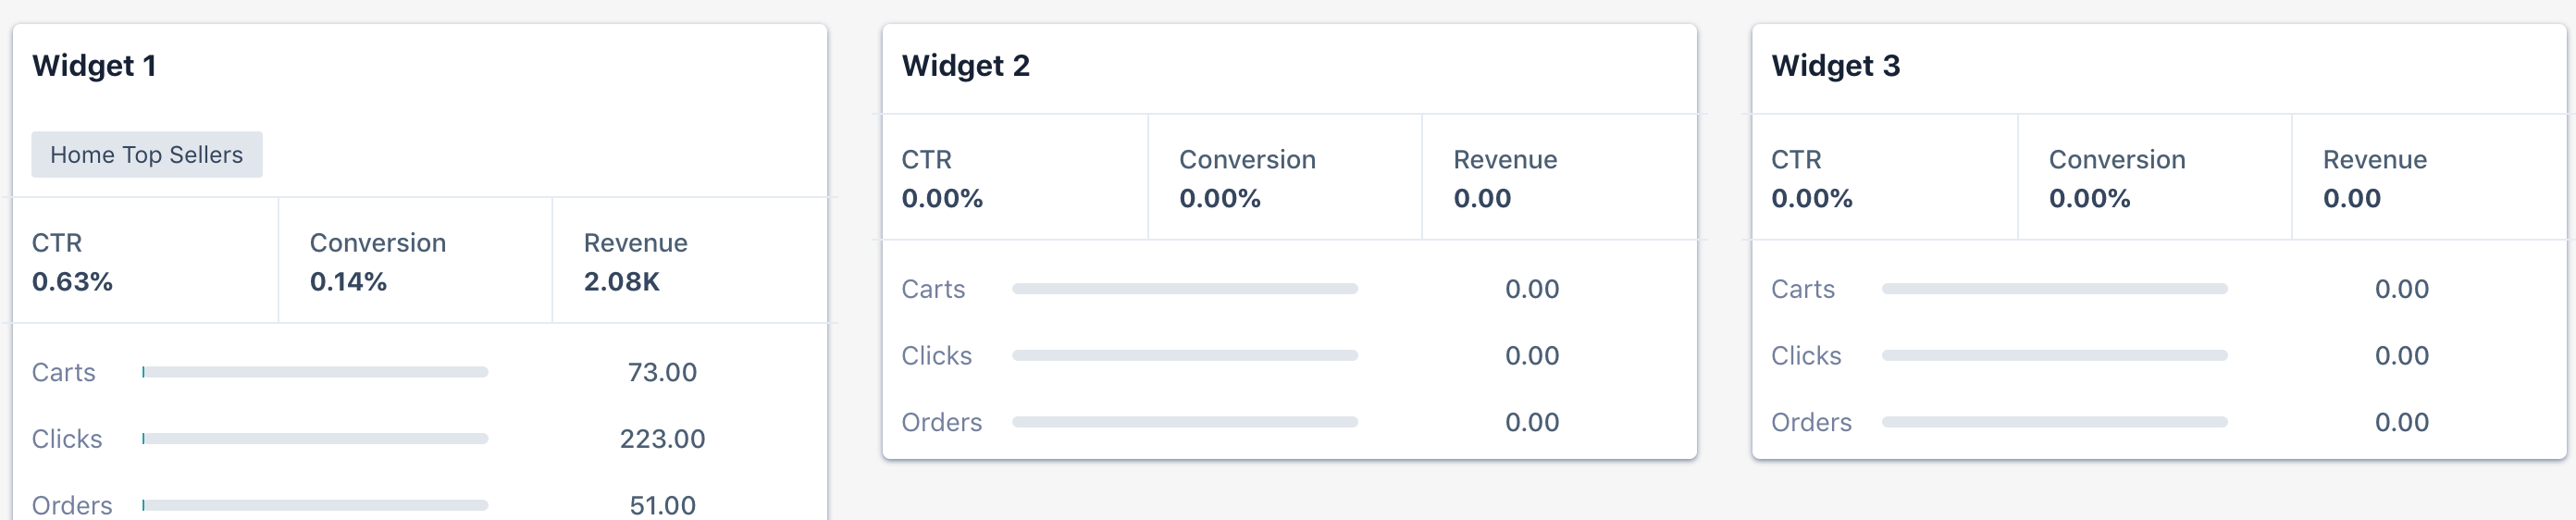
The widgets for the selected page type shows the insights of the calculated CTR, Conversion rate, and revenue.
Updated 2 months ago