Reports Search
The Search Overview report delivers high-level insights into search performance, including hits, clicks, revenue, and trends before deeper query analysis.
Overview
The Overview (Site) report provides a high-level summary of Search performance across your site. It helps you monitor traffic, engagement, and revenue driven by search, and identify trends over time.
Use this report as a starting point to understand overall search health before drilling down into query-level, product-level, or A/B test reports.
Reports Preview
The search report is divided into the following sections:
| Tab Name | Description |
|---|---|
| Site | Provides overall search performance metrics across the entire site, including hits, conversions, and trends. |
| Query Report | Delivers insights at the individual query level, such as search volume, performance, and click behavior. |
| Zero Result Query | Focuses on queries that returned no results, helping identify catalog gaps or keyword mismatches. |
| Product Level | Breaks down performance at the product level, showing which products are getting searched, clicked, or ignored. |
| A/B Tests | Tracks and compares performance between control and test groups, useful for evaluating changes like ranking logic, UI tweaks, or personalization strategies. |
Key Metrics
The Overview section displays aggregated performance metrics for the selected date range:
| Metric | Description |
|---|---|
| Hits | Total number of search requests made on the site. |
| Click Through | Number of times customers clicked on at least one product after making a search. |
| Cart Through | Number of add-to-cart actions originating from search results. |
| Sale Through | Number of completed purchases driven by search. |
| Revenue | Total revenue generated from search-driven purchases. |
Filters and Controls
Filters and Controls allow you to refine key metrics by adjusting the date range and applying segments to analyse search performance for specific time periods and user groups.
| Control | Description |
|---|---|
| Date Range | Select a predefined range (for example, Last 14 days) or define a custom date range. All key metrics and charts update based on the selected period. |
| Segments | Use Choose Segments to filter data by specific user groups, devices, or other configured segments. |
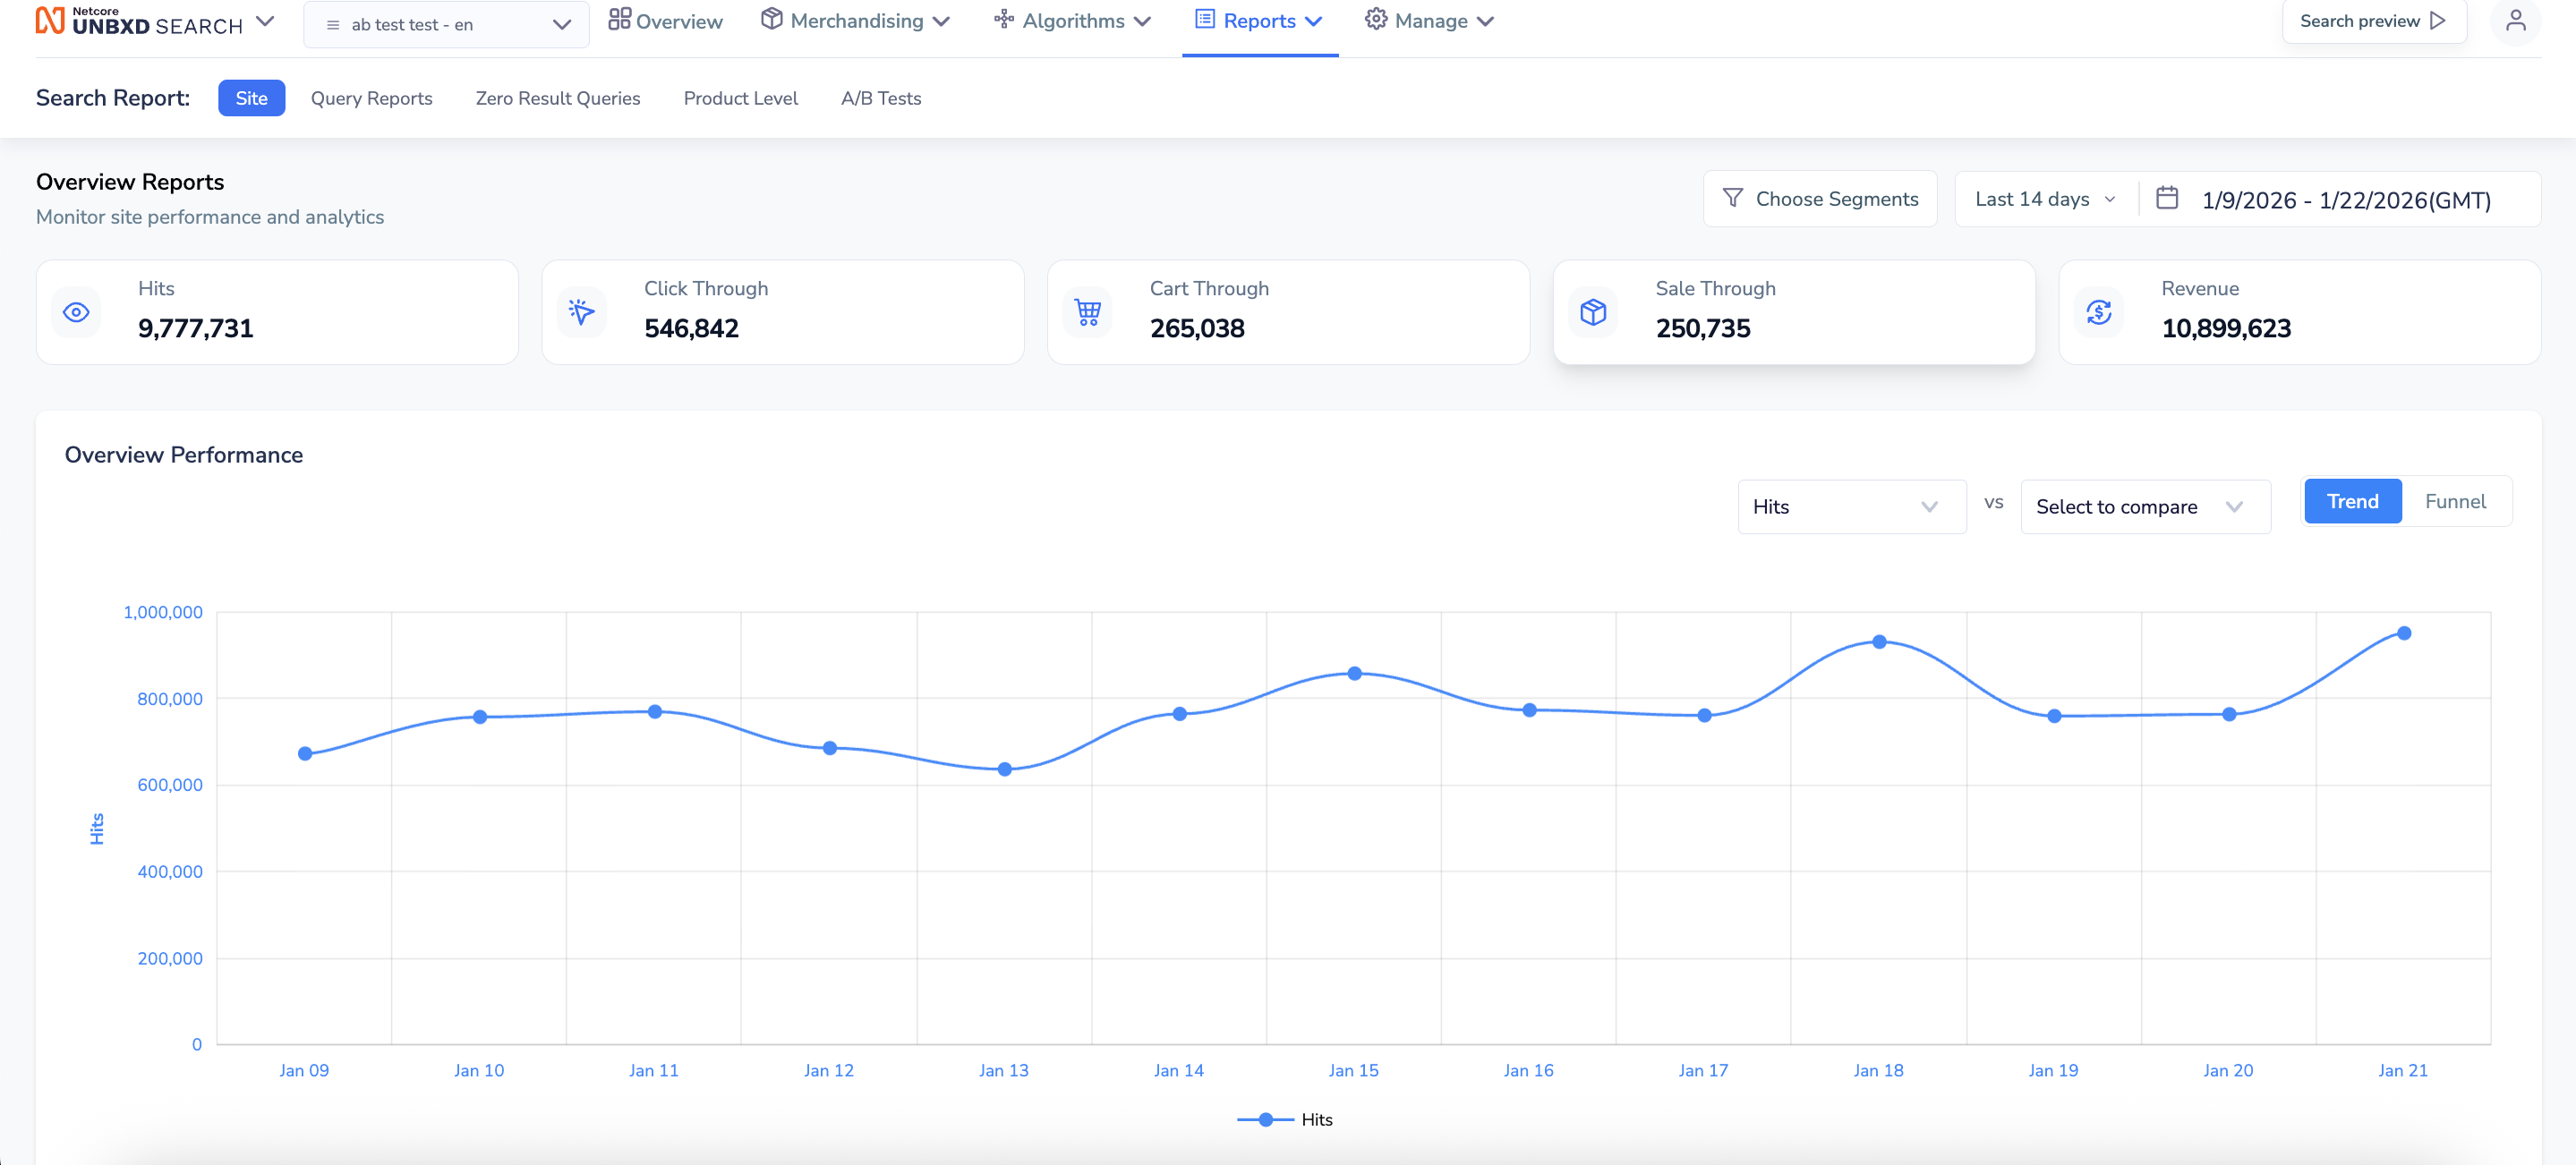
Overview Performance Chart
The Overview Performance section visualises search performance trends over time.
| Section | Description |
|---|---|
| Metric selector | Choose which metric to plot on the chart (for example, Hits). |
| Compare | Compare one metric against another to analyze relative performance. |
| Trend toggle | Displays metric performance over time. |
| Funnel toggle | Shows the conversion flow from search to purchase. |