
Shopping Agent: Overview
Navigate the dashboard, track shopping agent performance, and understand Shopping Agent engagement metrics.
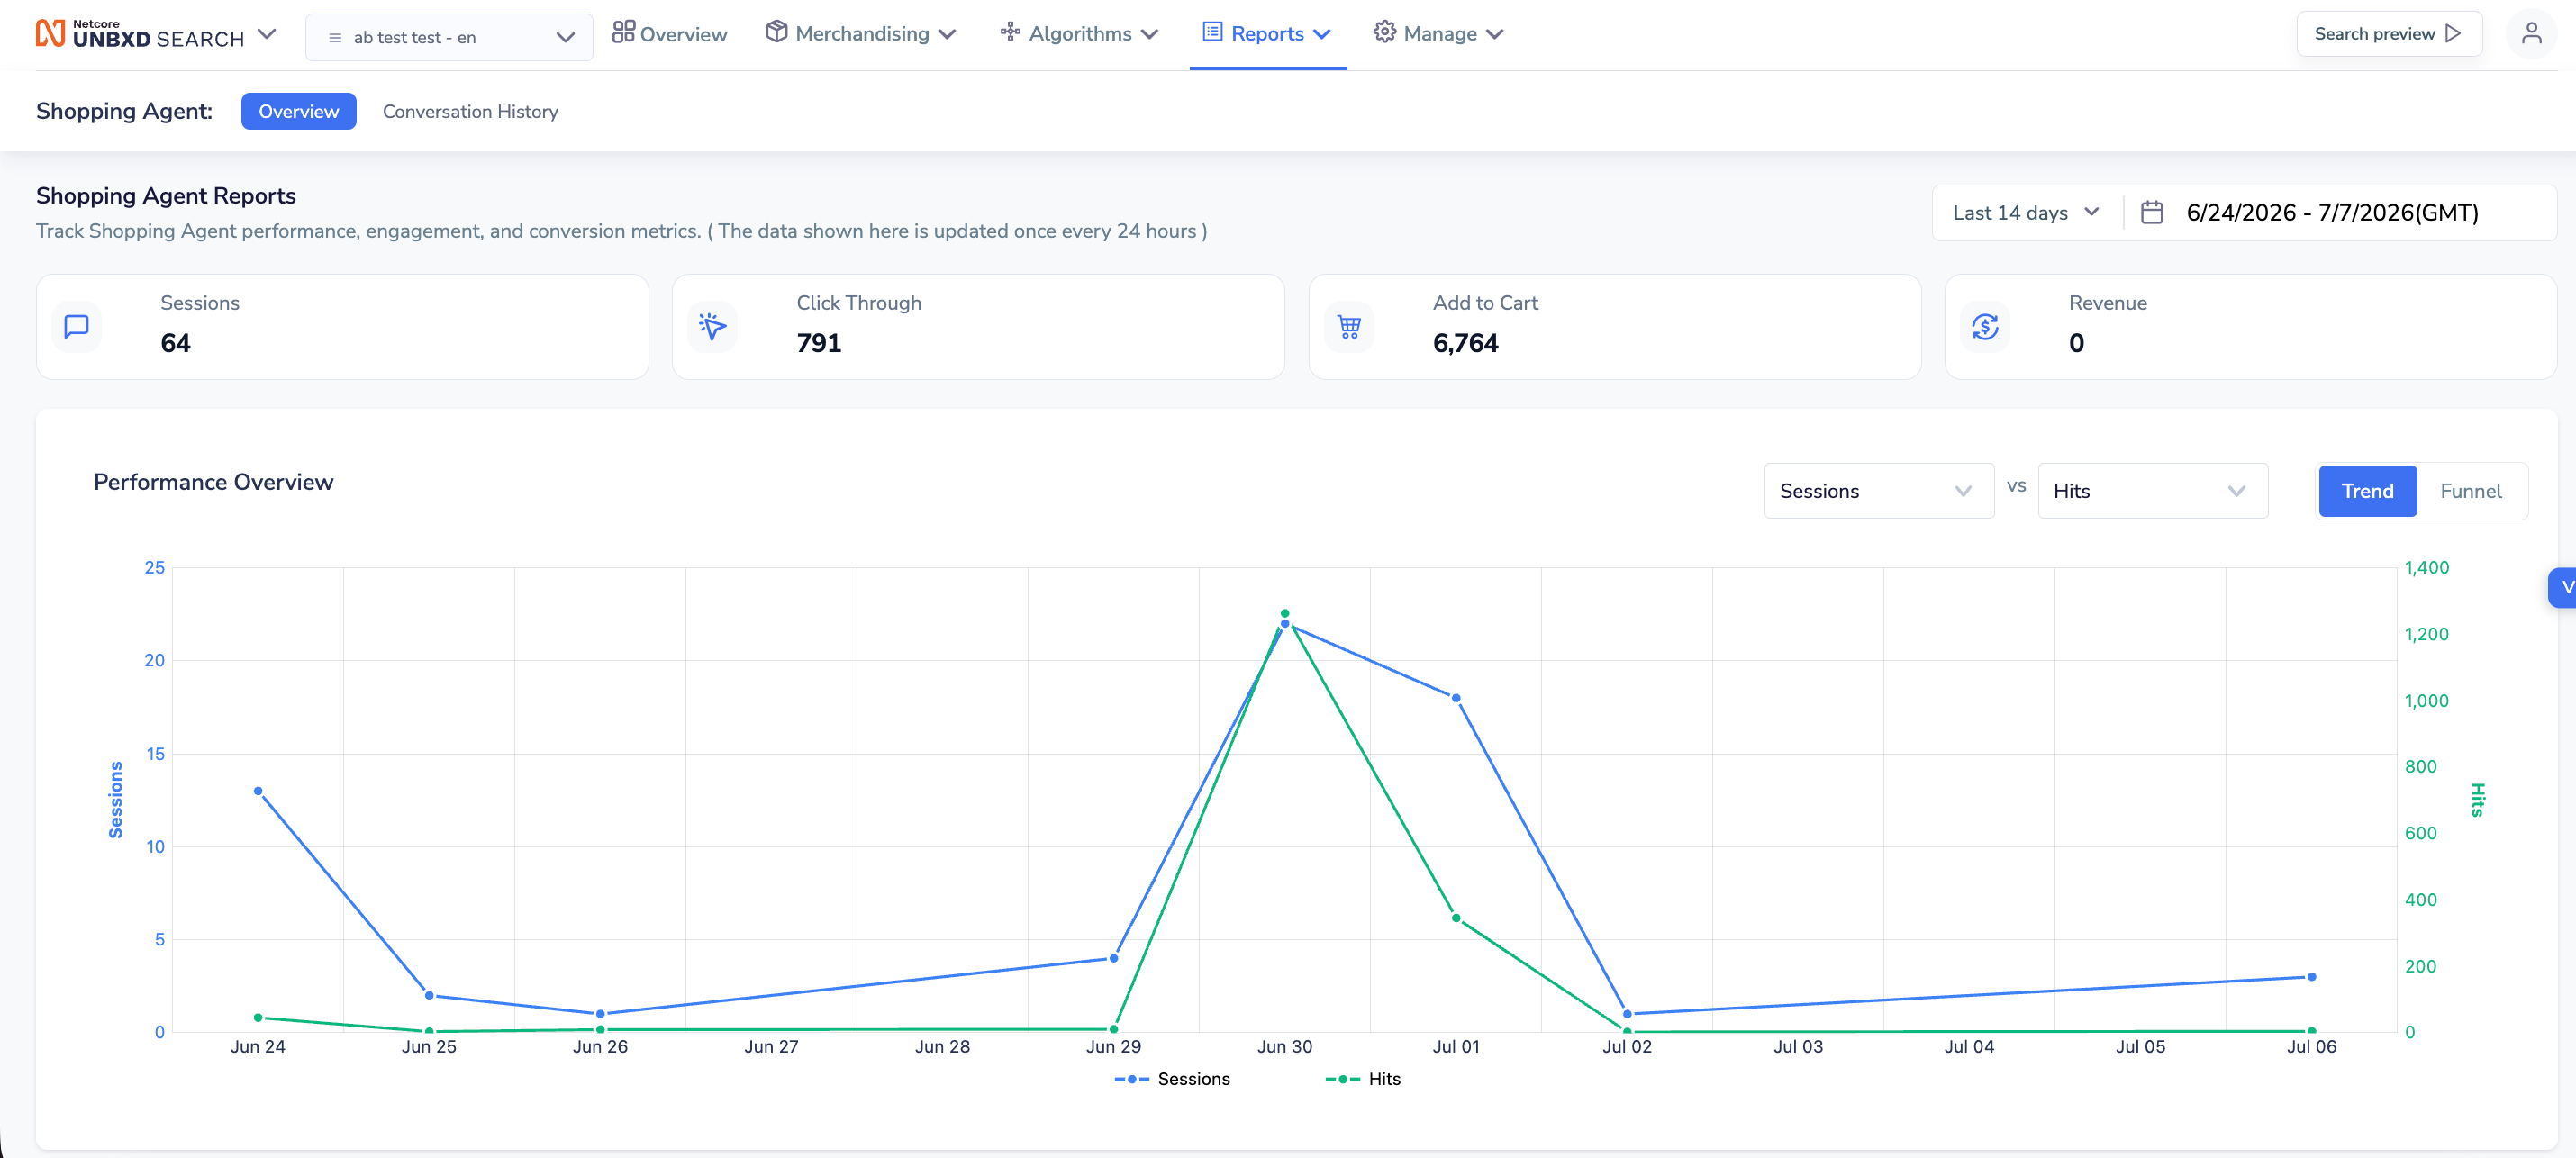
The Shopping Agent dashboard tracks agent performance, user engagement, and conversion metrics. The system updates this data once every 24 hours.
Access Shopping Agent Reports
Step 1: Open the Shopping Agent
- Navigate to the top menu bar.
- Click Reports.
- Select Shopping Agent from the dropdown menu.
Step 2: Overview Metrics
The top panel displays four high-level Key Performance Indicators (KPIs):
| Metric | Description |
|---|---|
| Sessions | Total number of customer interactions with the Shopping Agent. |
| Click Through | Total number of clicks on products suggested by the agent. |
| Add to Cart | Total number of times users add recommended items to their cart. |
| Revenue | Total monetary value generated through assistant interactions. |
Filtering and Customizing Data
You can refine the data view by changing the date range or toggling graph perspectives.
Step 3: Change Date Range
- Click the date filter dropdown at the top right of the dashboard.
- Select a preset range like Last 7 days, Last 14 days, Last 30 days, or Last 90 days.
- To choose specific dates, click Custom Range.
- Select your start and end dates on the calendar.
- Click Apply.
Step 4: Toggle Graph Views
The Conversation History section offers two visual formats:
- Trend View: Click the Trend button to see continuous performance over time. You can compare different attributes by selecting them from the dropdown menus (e.g., comparing Sessions vs Hits).
- Funnel View: Click the Funnel button to view conversion drops. This displays sequential user progress from initial Sessions down to Revenue.
Analyzing Product and Filter Performance
Scroll down the dashboard to view detailed tables that highlight popular items and successful filters.
Step 5: Check Top Performing Products
The Top Performing Products table displays items that users click and cart most frequently.
- Product Name: Shows the specific product SKU or ID.
- Clicks: Displays total interaction volume.
- Carts: Displays conversion intent per product.
- Orders: Displays finalized purchases.
Step 6: Review Applied Filter Suggestions
The Filter Suggestion Applied table shows which filters users click most often during conversational assistant sessions.
- Filter: Displays the name of the filter value (e.g., specific brand names or product categories).
- Associated Field Name: Identifies the metadata bucket, such as
brandNameorcategoryPath5. - Hits: Quantifies total clicks or selections for that filter.
Updated 3 months ago